Radiofarda – The Islamic Republic marked its 40th anniversary on February 11, 2019. Since 1979, the Iranian economy has experienced sharp fluctuations, mostly during the Iran-Iraq war (1980-1988), international sanctions era (2012-2016) and more recently after the U.S. withdrawal from the 2015 Iran nuclear agreement in May 2018.
According to the International Monetary Fund, Iran’s GDP based on purchasing power parity (PPP) would reach 1,627 billion international dollars in 2019, but based on U.S. dollars it would stand at $333.6 billion.
GDP based on USD means the total worth of produced products and services annually calculated based on the exchange rate of the local currency and U.S. dollars; but there is another way for measuring GDP: based on purchasing power parity (PPP).
The PPP index measures the real purchasing power of citizens in a country and not just their income based on nominal U.S. dollars. Let’s assume that every U.S. citizen’s share of GDP is $16 while in country B it is $20. Does this mean that people in country B can buy more and live better? Not necessarily, if goods and services are more expensive there then they are not richer than Americans. Although in nominal dollars Americans make less but they can buy more.
This is why GDP is measured both in nominal U.S. dollars and also based on purchasing power parity or PPP.
We will show Iran’s GDP trend during the last 40 years based on both measuring methods.
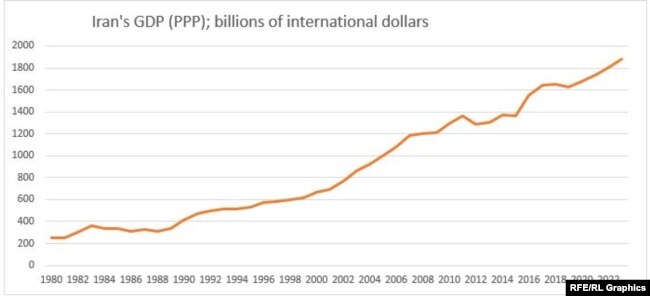
Iran’s GDP PPP grew 648% to $13,253 billion by 2018, compared to 1980.
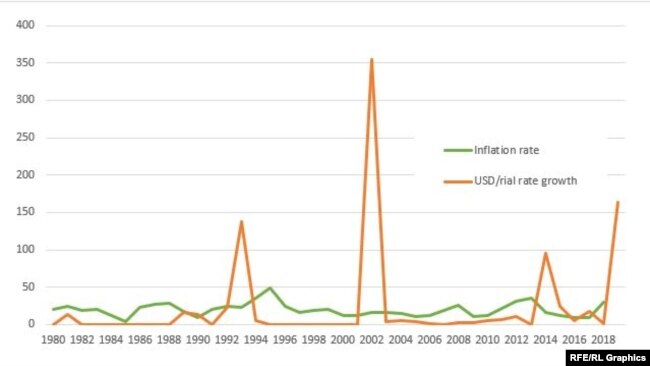
In Iran’s case the difference between GDP by real U.S. dollars and GDP PPP is even more stark. That is because the U.S. dollar has risen astronomically in Iran in 40 years, from 70 rials to the dollar in 1979 to 130,000 rilas now. So if we calculate how much the country produces in real U.S. dollars the figure comes out to be very low.
On the other hand, based on the PPP calculations by the International Monetary Fund, Iran’s total goods and services are much higher, because prices have not risen as much as the dollar has risen. If prices have not risen as much as 70-120,000, then Iranians are not as poor as this huge dollar gap might indicate.
But there is a more important explanation for the seemingly better PPP results. Iran heavily subsidizes many goods and services, creating the impression that consumers seem have a bigger purchasing power. In reality, it is a highly questionable economic policy to subsidize food and fuel instead of making real, productive investments to create self-sustaining growth and good living standards.
IMF and other international organizations also rely mostly on data supplied by the Iranian government on inflation, unemployment, etc. There are no independent bodies in Iran to provide reliable data. Politically sensitive information figures such as inflation can always be manipulated in the Islamic Republic’s ideological political setting.
This is why many economists do not value the GDP PPP approach and prefer to look at GDP based on real U.S. dollars. PPP might be a better way of measuring growth for advanced counties, where there is little subsidy and full and reliable data, but in case of countries such as Iran, the PPP calculation distorts the reality.
According to IMF’s forecast, Iran’s GDP PPP would decline only 3.6% in 2019 from 2018, but GDP based on USD is projected to decrease by 22.4% (from $430 billion in 2018 to $333.6 billion in 2019). The reality is much closer to the actual U.S. dollar based calculation than on purchasing power parity model.
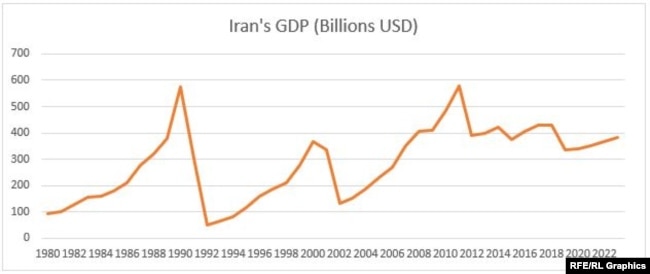
Iran’s GDP based on USD grew only 256.8% to $430 billion since 1980 and expected to plunge to $333.6 billion in 2019. This shows a huge difference with the way IMF and others measure Iran’s GDP, at much higher rate.
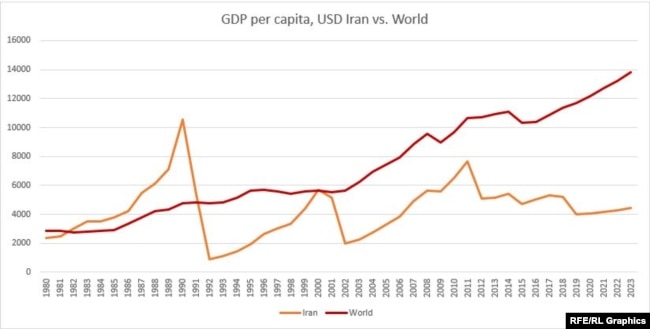
The other important economic performance is GDP per capita. Iran’s GDP PPP has grown 648% during the last 40 years, but considering the growth of its population, GDP PPP per capita hasn’t increased as much as total GDP PPP has.
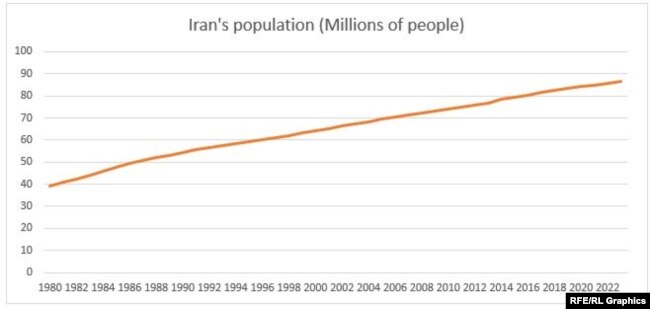
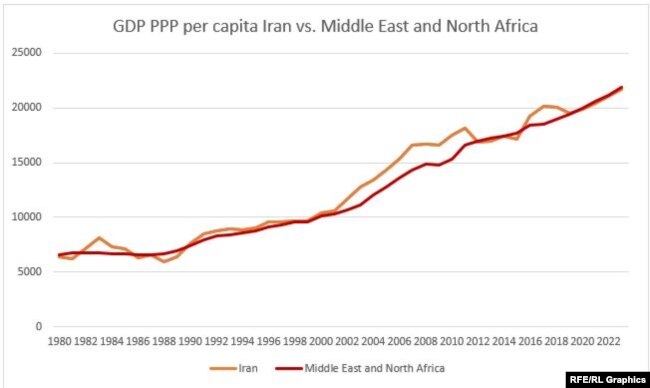
Iran’s population more than doubled during the last 40 years, but GDP PPP per capita increased by 240% — as much as the rest of Middle East and North Africa–, and GDP per capita, based on USD has grown only 85.34% — while globally the index grew 385% during last 40 years.
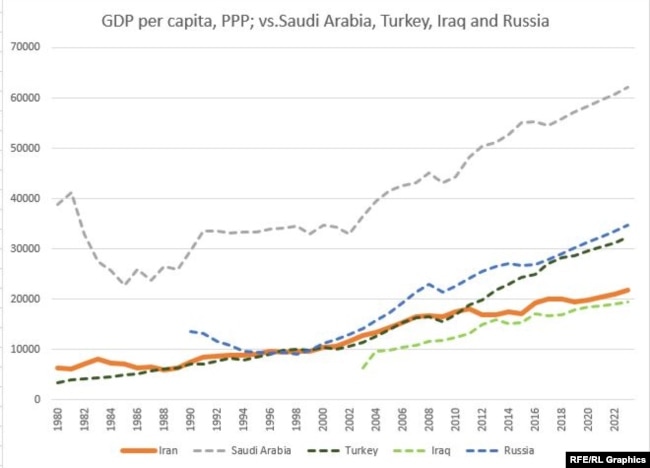
But if we compare Iran as an oil producer with Suadi Arabia, Iraq and Russia, even based on GDP PPP, Iran’s per capita growth has been lagging behind. Turkey is included not as an oil producer but as a neighboring country with roughly same population.
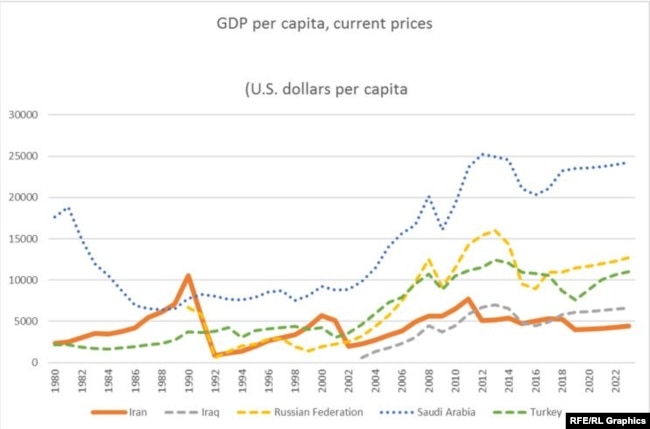
If we look at the below chart, showing growth in real dollar terms, Iran’s weak position becomes even starker. Even Iraq, with internal insecurity and war against ISIS, started getting ahead of Iran.
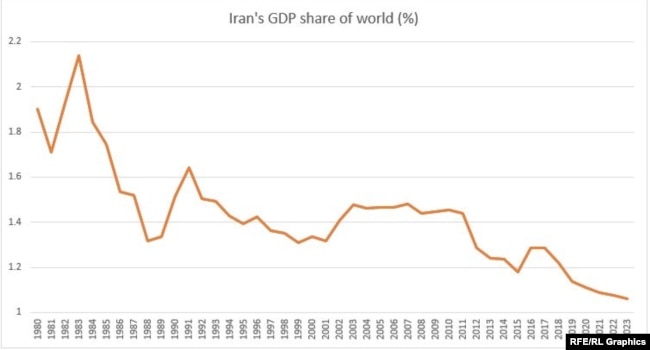
And finally, the most important index, which shows the country’s real weight in global economy: The share of Iran’s GDP in the world.
40 years ago, Iran had 1.9% share in global economy, but the it plunged to 1.22% in 2018 and expected to reach about 1% in 2022.
-

Dalga Khatinoglu
Dalga Khatinoglu is an energy analyst from Azerbaijan who contributes to Radio Farda.