environmentalsystemsresearch – The climate change fact is intensive among the Middle East countries and especially Iran. Among the Middle East countries, Iran will experience an increase of 2.6 °C in mean temperatures and a 35% decline in precipitation in the next decades. In vice versa, Iran by total greenhouse gas (GHG) emissions nearly to 616,741 million tons of CO2 is the first responsible country to climate change in the Middle East, and seventh in the world. The high-level contribution of Iran to emissions of GHG depends on a significant production of oil, gas, and rapid urbanization. The present study aimed to reveal an overview of climate change facts and statistics in Iran.
Results
In this manuscript, the evidential facts on climate change were investigated in global, regional, and national scales. For this purpose, the main increasing annual temperature and GHG emissions were considered. Besides, the variations of meteorological characteristics such as surface temperature, total precipitation, and upward longwave radiation (ULR) were reviewed in Iran indicating an anomalous decrease in precipitation events and anomalous increase in ULR and temperature characteristics confirming the global warming/climate change effects. Afterward, the legislative agreements on climate change concerning international adoptions and conventions were reviewed from Rio 1992 to NY 2016.
Conclusions
The results showed that further research and development should be considered the novel methods to explore renewable energy applications and to mitigate GHG emissions in order to overcome the increased risk of climate change effects. Technological affairs and international participants should support this target.
Introduction
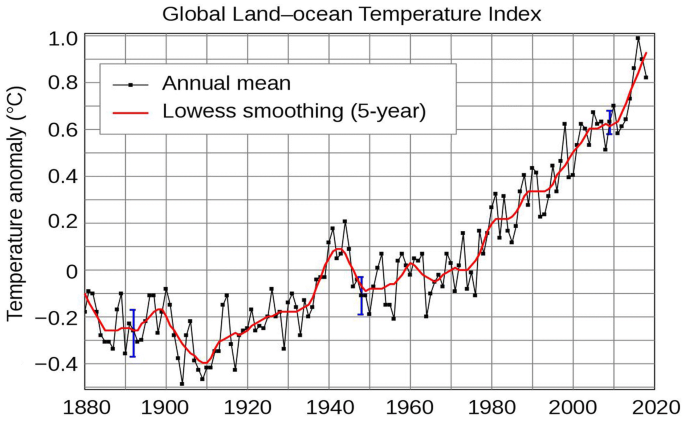
Based on the synthesis report (SYR) of climate change in 2014 titled as the final part of the Intergovernmental Panel on Climate Change (IPCC)’s Fifth Assessment Report (AR5), warming data in the climate observations are unequivocal and sometimes are unprecedented during decades to millennia. The warming event has been observed into the atmosphere and ocean temperatures together with decreasing snow and ice covers and raising sea levels (IPCC 2014). Based on the reanalyzed index of global land–ocean temperature prepared by National Aeronautics and Space Administration (NASA) combined land and ocean skin temperature represents warming approximately to 1.35 °C between 1880 and 2018 (Fig. 1). This figure illustrates the increasing trend of global surface temperature. According to within 138-year records, the warmest years have occurred since 2000. The year 2016 revealed as the warmest record on the data (NASA 2019).
Based on the IPCC’s AR5, since 1950 cold temperature extremes have decreased and both hot thermal extremes, heavy precipitation events have increased (IPCC 2014). The report reveals the driven role of anthropogenic effects on the increasing concentrations of carbon dioxide (CO2), methane (CH4) and nitrous oxide (N2O). Cumulative CO2 emissions have been estimated as 2040 ± 310 Giga tons CO2 during 1750–2011 (IPCC 2014). Furthermore, the time series of Carbon Dioxide Information Analysis Center (CDIAC) in 2014, the global carbon emission has been estimated nearby 9.795 Giga metric tons of carbon (CDIAC 2014).
The Earth’s climatic system has six Hadley cells that are responsible for the alternating wet and dry climate bands. This pattern of uneven heating drives convection, or heat-driven circulation, of the oceans and atmosphere. On this basis, the hot semi-arid and arid zones lie beneath dry and sinking air in mid-latitudes (~ 15°–30° N and S) such as the Middle East region. Relative to 1850–1900, the global surface temperature for the end of the 21st century (2081–2100) is projected to exceed 1.5 °C based on representative concentration pathways (RCP) scenarios of RCP4.5, RCP6.0, and RCP8.5. On this basis, mean precipitation will decrease for dry subtropical regions in mid-latitude countries. Thereafter, the climate modeling and simulations prospect the high-level variability and frequency of climate extremes in these regions (IPCC 2007).
There is extensive evidence that in a warmer climate of the Earth’s system the subtropical dry zones have been pushed into areas which previously had a temperate climate (Previdi and Liepert 2007; Lucas et al. 2014). Nevertheless, changes in the global climate have been previously studied (e.g., Stephens and Ellis 2008; Trenberth 2011), and indicated the global averages cover regional complexities and differences. Regionally different changes in the frequency of extreme weather events in response to the changing climate have been noted in some previous studies (Lucas et al. 2014).
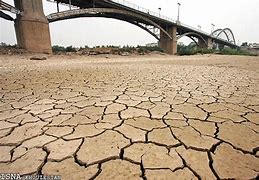
Thus, the present study attempts to review climate change at the regional scale over Iran. Hence, the present study aims to investigate the facts and statistics of climate change in Iran due to reveal the global role of climatic surveys and programs on national mitigation and adaptation strategies. For this purpose, the present article attempts to reveal an overview of climate change facts and statistics in Iran. Investigating climate change facts is essential in arid regions such as Iran, where the dry condition may increase under global warming (Karandish et al. 2017). Madani (2014) highlights Iran’s water crises including depleting groundwater levels, drying lakes, water supply, and extreme events. With nearly 85% of the country being in semi-arid and arid climates, the country faces both prolonged droughts, as well as floods. In the past two decades, floods have affected 11 million people in Iran and caused over 2600 fatal casualties (Madani 2014).
Data and method
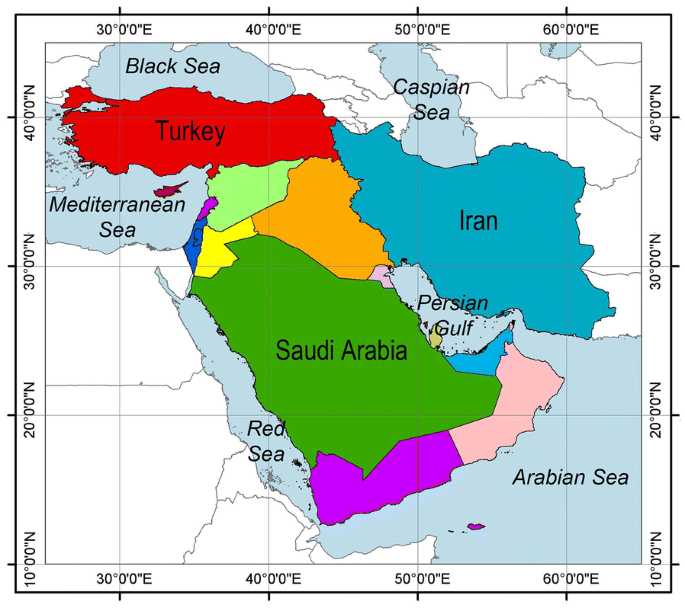
With a total area of 1.648 million km2, Iran locates between 45° and 63° East and 25°–40° North in the Middle East (Fig. 2). The general climate of Iran represents an arid and semi-arid character in the mid-latitude position. Except for the western parts and the northern coastal areas, Iran’s climate is mainly arid and semiarid (Sodoudi et al. 2010; Fallah et al. 2017) and rainfall is observed dominantly depends on geographical latitude and topographical altitude (Razmi et al. 2017). Most of the precipitation in Iran has been influenced by the pressure center of western Mediterranean oscillation (Ghasemi and Khalili 2008). Albeit, significant influences of El Niño southern oscillation on other meteorological parameters such as air temperature in Iran were also reported by Nazemosadat and Ghasemi (2004), Sabziparvar et al. (2010) and Choobari et al. (2017).
Some global and national official reports, e.g., IPCC (2007, 2012, 2014) and National Climate Change Office of Iran (NCCOI 2010, 2014) were used to collect required data. Furthermore, several web sites were considered to access the remotely sensed climatic data, e.g., NASA (2019) and CDIAC (2014). For exposing climate facts of Iran, a broad literature review was carried out.
A set of spatiotemporal time-series was extracted from the two data sources on the web to access, visualize, and analyze the data to present further encouraging evidence concerning the change of climatic variables of Iran. For this purpose, three major climatic variables including surface air temperature, upward long-wave radiation (ULR) flux, and total surface precipitation were considered spatially for Iran (25°–40°N and 45°–63°E) by monthly scale within a long-time period of 1978–2018. The variables were extracted from Geospatial Interactive Online Visualization and Analysis Infrastructure (GIOVANNI 2019) via http://www.giovanni.sci.gsfc.nasa.gov/giovanni. GIOVANNI ver. 4 is an online data source developed and maintained at the National Aeronautics and Space Administration, Goddard Earth Sciences Data and Information Services Center (NASA_GESDISC).
Furthermore, variables mentioned above with same temporal windows were extracted spatially for the Tehran metropolitan (35°N and 51°E) as the capital of Iran from the Asia Pacific Data Research Center (APDRC 2019) data set via http://apdrc.soest.hawaii.edu/las/getUI.do. APDRC is a highly configurable web-based data server designed by the National Oceanic and Atmospheric Administration (NOAA) to provide flexible access to remotely sensed and geo-referenced scientific data.
The upward long-wave radiation provides one of the critical components of the Earth’s surface energy budget, which is an essential factor in determining the temperature fields and thermal islands at the Earth’s surface level. In addition to upward long-wave radiation, surface air temperature as a commonly measured weather parameter is a measure of how hot or cold the air is, describing the energy of motion of the gases that make up air. The precipitation measurement mission is an international network of satellites that provide all observations of rain and snow to improve accurate and timely information of Earth’s water and energy cycle (Sarvari 2019).
To analyze of time series, the processed data was acquired from the web-based gathered data by using Microsoft Excel and SPSS software. The range of variables was estimated and then was selected based on validating access, study periods, and accuracy of statistics. In the last step, a statistical attitude was considered to estimate the anomaly of time series. The term anomaly was defined as implying deviation of the mean atmospheric value from a reference field in a time-period (Ouzounov et al. 2007). The limits between standard deviation from the long-term average (± sigma) are defined with 85% confidence intervals. The variations and perturbations outside of the between upper and lower limits of the confidence interval are considered statistically significant anomalies (Tabari et al. 2014).
Result and discussion
Current climate change and warming facts in Iran
The IPCC estimates an increase in temperature in the Middle East up to 2 °C in the next 15–20 years and over 4 °C by the end of the century. This fact is combined with a decline in precipitation by 20% (IPCC 2007; Elasha 2010). Hence, the Middle East countries are very vulnerable to facing climate change effects. Among the Middle East countries, Iran will experience an increase of 2.6 °C in mean temperatures and a 35% decline in precipitation in the next decades (NCCOI 2014). Hence, the climate change fact of Iran is more severe than the Middle East region.
Several researchers have reported the heat waves will be increased (30%) by the end of the century for Iran and West Asia (Zhang et al. 2005; Rahimzadeh et al. 2009; IPCC 2012). Therefore, many reports observe a steady decline in annual rainfall (~ 30%) (Nazaripour and Daneshvar 2014). Spatial and temporal trend of precipitation has been widely studied in Iran by several researchers. The literature review revealed that two high mountain ranges of Zagros and Alborz in west and north, respectively, strikingly affect the temporal and spatial patterns of rainfall and temperature (Dinpashoh et al. 2004; Modarres and Sarhadi 2009; Tabari and Talaee 2011; Raziei et al. 2012; Soltani et al. 2012; Somee et al. 2012; Dinpashoh et al. 2014; Darand and Mansouri Daneshvar 2014; Darand et al. 2015; Zarenistanak et al. 2015; Ghalhari et al. 2016; Roushangar et al. 2018).
For instance, Rainfall trends analysis of Iran using the Mann–Kendall test indicated a decreasing trend in annual and seasonal precipitation at stations mostly occurring in the northwest of Iran (Modarres and Sarhadi 2009). Similar research using the Mann–Kendall test showed a significant negative trend in annual precipitation series at Iran especially in the winter series (Tabari and Talaee 2011). Another research found a relatively regular year-round distribution of precipitation in the north of Iran, but an extreme concentration of precipitation in a few months of the year was detected for the southern country (Raziei et al. 2012). A noticeable decrease in the precipitation series has been indicated in northern Iran, which has temperate weather affected by Alborz Mountains and the Caspian Sea (Somee et al. 2012).
Regionalization of precipitation regimes in Iran using principal component analysis and hierarchical clustering analysis revealed that the main precipitation regime is in the winter season. In some parts of southern and southeastern of Iran, more than half of the total precipitation occurs in the winter. With moving away from the mentioned regions to the north and the Caspian Sea coast, the contribution of autumn precipitation to total one becomes higher than winter precipitation. The precipitation regime of northwestern parts of Iran is classified in the spring season. The contribution of summer precipitation to total precipitation is noticeable in the southern parts of the Caspian Sea and Southeastern areas (Darand and Mansouri 2014). Spatial and temporal trend analysis of temperature extremes in Iran revealed that about 66% of the country has a significant positive trend in the frequency of hot days and nights, while about 40.9% and 68.5% have a significant decrease in frequency of cold days and nights, respectively.
Besides, a significant increasing trend (~ 30%) of hot extremes was revealed in central and southern regions of Iran, which are comprised Great Kavir and Lut desert out of mountainous zones (Darand et al. 2015). Therefore, other researchers indicated significant decreasing trends at snow cover of Iran based on all the models under projection scenarios (Zarenistanak et al. 2015). The results of the local Moran’s index and hotspot analysis revealed that the precipitation along the Caspian Sea’s coast, western and southwestern parts of Iran had a positive spatial auto-correlation, while the precipitation variation in central Iran and along the southern coastline of the country showed a negative spatial autocorrelation (Ghalhari et al. 2016). Exploring the effects of teleconnection climatic indices on monthly precipitation in Iran revealed that all climatic features except NAO index influenced precipitation in Iran during 1960–2010 (Roushangar et al. 2018).
It can be noticed that the most mentioned studies have considered climatic and synoptic stations throughout the country by different periods. By a long-term period, the spatial distribution for annual precipitation showed a downward trend in northwestern and southeastern Iran (Raziei et al. 2014). Researchers have indicated the significant anomalies in precipitation extremes in the northwest and southeast regions of Iran along the Zagros Mountains (Tabari et al. 2014). Under climate change effects, all meteorological characteristics of Iran have been altered. For instance, the role of the Siberian high-pressure extension in Iran’s climate has changed spatially and temporally from temperature fluctuating to drought controlling (Ghanghermeh et al. 2015). Hence, one of the climate change facts in Iran is increasing trend of drought severity together with the decreasing trend of rainfall and flood magnitude (Modarres et al. 2016). However, climate changes and global warming affect precipitation and extreme events such as floods and droughts in Iran (Eslamian et al. 2011). During the past 40 years, the average decreasing rate of precipitation in the study area was 2.56 mm/year (Zohrabi et al. 2014). Moreover, climate change can affect water resources, agriculture, environment, public hygiene, industry, and economy (Samadi et al. 2009; Gohari et al. 2013).
Statistical analyze of climate change in Iran
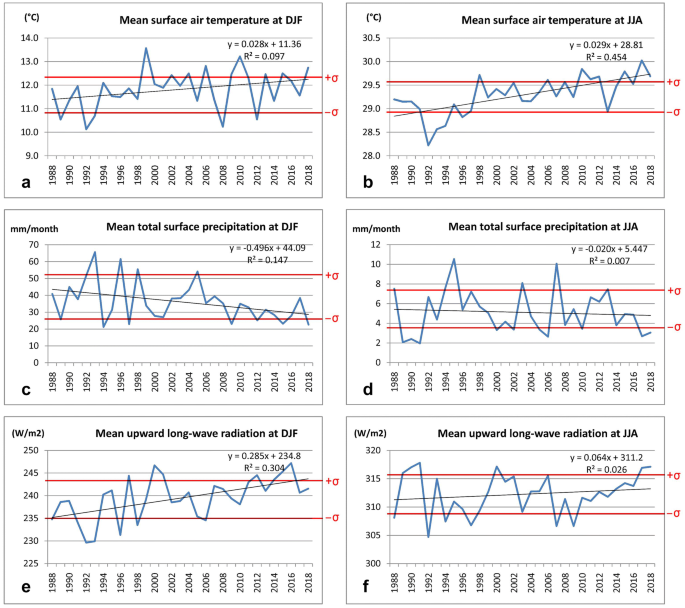
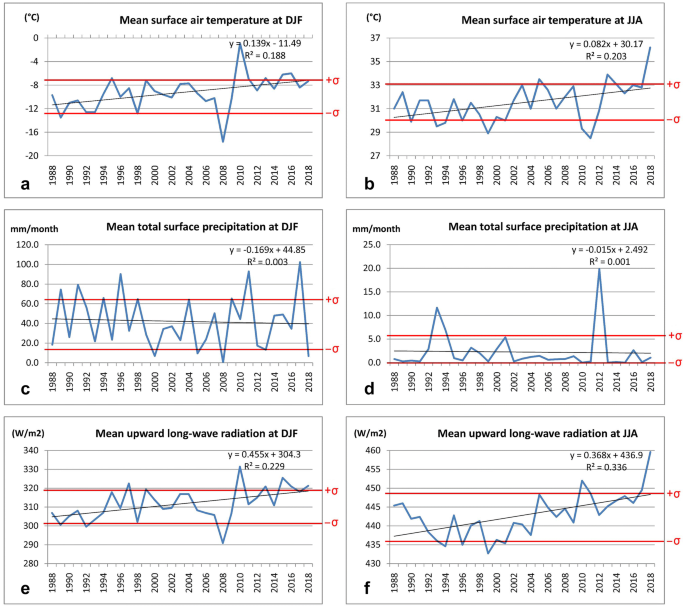
In the present research, the temporal variations of three major climatic variables were plotted within 1988–2018 over Iran for winter (DJF) and summer (JJA) periods in order to define statistically significant anomalies (Fig. 3). This figure revealed that the variable of mean surface air temperature increased dramatically both in minimum and maximum records of winter and summer periods, respectively. The anomalous increases with a high slip of increasing trend were observed for the summer (JJA) period especially in the recent decade (2008–2018). Contrarily, the variable of mean total surface precipitation decreased dramatically both in minimum and maximum records of summer and winter periods, respectively. The anomalous decreases with a high slip of decreasing trend were observed for winter (DJF) period. These decreases are very crucial for nature and society of the country because most of the precipitation in the semi-arid regions of the Middle East such as Iran is contributed to winter times. Therefore, the variable of mean upward long-wave radiation (ULR) increased dramatically both in winter and summer periods, indicating the increasing heat on top of atmosphere especially in winter period especially in recent decade (2008–2018). The ULR heating evidence in upper air levels can explain the decrease of precipitation capacity on the winter periods.
To present detailed evidence of climate change in local scale, the temporal variations of three major climatic variables were plotted within 1988–2018 over the Tehran as the capital city of Iran for winter (DJF) and summer (JJA) periods (Fig. 4). Tehran metropolitan with 800 km2 surface area and a total population of 8,286,198 (SCI 2016), has a semi-arid climatology averagely with a mean annual temperature of 17 °C and annual precipitation of 230 mm within 1950–2000 (Hijmans et al. 2005). In Tehran, the variable of mean surface air temperature and ULR increased both winter and summer times in similar to the whole of Iran. The highest values of temperature and ULR maybe depend on the highest level of GHG emissions such as NO2 in Iran and the whole Middle East (Mansouri Daneshvar and Hussein Abadi 2017). Fanni et al. (2013) have indicated that the climatic change and its effect such as the increasing trend of temperature are accompanied by changes in urban population growth in Tehran.
Future climate under GHG emissions in Iran
The growth of CO2 emissions in the Middle East is the third largest in the world within 1990–2004 (Elasha 2010). According to global monitoring of CO2 (CDIAC 2014), three countries of Middle East are among the five highest CO2 emission rates in the including Qatar (11.03 metric tons of carbon per capita), Kuwait (7.43), and Bahrain (6.46). Therefore, three countries of Iran (168.25 million tons of carbon), Saudi Arabia (147.65), and Turkey (88.21) are responsible for fossil-fuel CO2 emissions of the region by more than 65%. Iran by total CO2 emissions nearly to 168,251 in thousand metric tons of carbon (616,741 million tons of CO2) is 7th in the world (Fig. 5). However, Iran has national per capita CO2 emission equal to 2.18 as of 47th in the world. The National Climate Change Office of Iran has published the inventory of GHG emissions in two time-intervals of 2000 and 2010 (NCCOI 2010, 2014). The summary of direct and indirect GHG inventory in Iran for both 2000 and 2010 are shown in Tables 1 and 2, respectively. The total CO2 emission from different sectors is about 375,186 and 677,330 Giga tons in 2000 and 2010 respectively. The total CO2 equivalent emission is estimated to be about 491,051 and 1,092,650 Giga tons in 2000 and 2010 respectively. According to the Tables, the total CO2 equivalent emission has been increased by 23% per year.
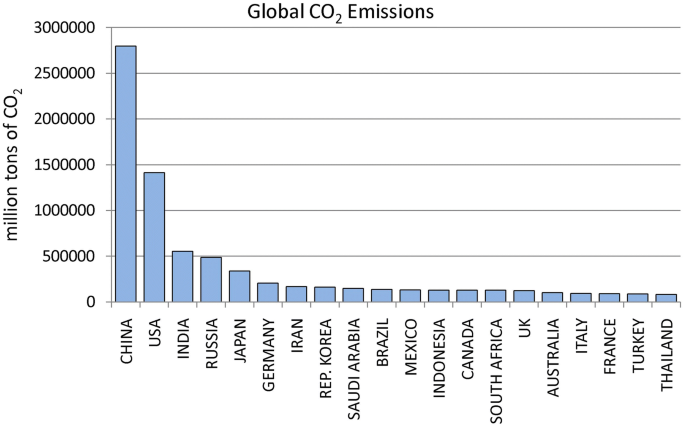
Table 1 Inventory of GHG emissions (Giga ton) for all sectors in 2000, after NCCOI (2010)Full size tableTable 2 Inventory of GHG emissions (Giga ton) for all sectors in 2010, after NCCOI (2014)Full size table
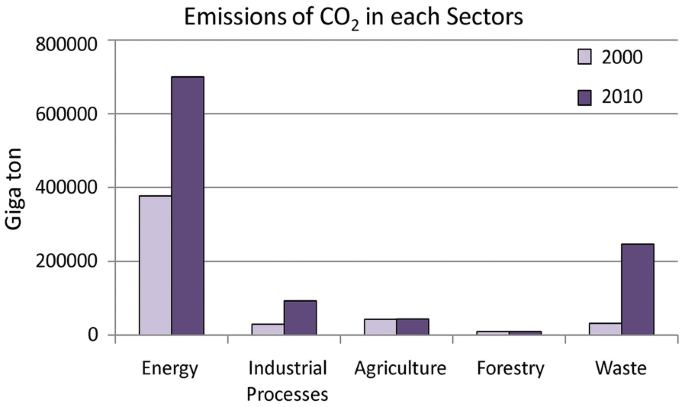
The variation of total CO2 equivalent emission for each sector between 2000 and 2010 are presented in Fig. 6. This figure reveals that the main emission sources in Iran belong to the energy and waste sectors. The energy sector solely is contributed to 86–90% of total GHG emissions. Urban-related resources from the energy sector of Iran are contributed to approximately 50% of total GHG emissions. Recent research on the urban-related variation of nitrogen dioxide hotspots revealed that the high values of NO2 concentrations (over than 50 xle14/cm2) spatially corresponded on the large urban regions in the Middle East and Iran (Mansouri Daneshvar and Hussein Abadi 2017). This fact explores the indirect urbanization effects on climate change. Contrarily, the urban regions are under the great impacts of climate change such as heat islands, air pollutions, and anti-health disasters. Based on the statistical center of Iran, the urban population of Iran is approximate to 59,147,000 from total 79,927,000 (SCI 2016).
On this basis, nearly 75% of the population in Iran has settled in the urban regions. Researchers showed significant positive trends for temperature variations at several urbanized regions in Iran. For instance, researchers revealed that the increase in urban population and as well as urbanization means an increase in demand for transportation and its heat effect (Dulal et al. 2011). Iranian economic and industrial progress has taken a faster pace in the last decades, and fuel assumption and emission of greenhouse gasses has been increased. Hence, due to the increase in population and transportation in Iran, the level of GHG concentration and temperature variation in the urban atmosphere will increase in the future.
The comparison between the past and future climatic trends of Iran showed that temperature would increased and precipitation decreased under the effect of greenhouse gases emissions (Zohrabi et al. 2014). In this regard, temperature projection models show that temperature may increase between 1.12 and 7.87 °C by 2100 in Iran. However, precipitation may decrease according to most of the future models and scenarios. Similarly, snow covers projection show that snow cover area may decrease at the end of the twenty-first century consistent with the projected increase in temperature (Zarenistanak et al. 2015). Such results may lead to an anthropogenic-based climate change, which has considerable negative socioeconomic impacts on the agriculture and industry sectors. Moreover, increasing risk of droughts in the future will threaten water and food security especially for people who live in the highly populated cities due to extra pressure on the limited freshwater resources (Karandish and Mousavi 2018).
Conclusion
The climate change fact of Iran is more severe than the Middle East region. Most of the researches indicate a dryer regime for the future in addition to lesser precipitation events, which is more evident in the warm season (Shamami et al. 2018) indicating the changes inconsistent with global warming/climate change (Abolverdi et al. 2014). Based on recent scientific reports, the frequency of extreme precipitation will be decreased in Iran (Choobari and Najafi 2018) and then an increased risk of droughts in the future periods will threaten water and food security especially for people who live in the highly populated cities of Iran (Karandish and Mousavi 2018). The high-level contribution of Iran to GHG emissions depends on a significant production of fossil fuels and fast urbanization.
According to the results of the present research, the temporal variations of three major climatic variables of temperature, precipitation, and ULR have indicated positive or negative anomalies for winter (DJF) and summer (JJA) times in Iran during the long-term period of 1988–2018. The same variations were studied spatially over the Tehran region. The results revealed the anomalous increases of temperature and ULR in addition to the anomalous decrease of precipitation especially in recent decade (2008–2018). Hence, climate change facts are statistically observable in the past times and predictable in the future periods. For instance, Bazrkar et al. (2015) have estimated an increase in monthly temperature in prospective years for Tehran based on SRES scenarios of the IPCC.
International adoptions and conventions on climate change have been developed from Rio 1992 to NY 2016. Iran participated in 21st Conference of the Parties of the United Nations Framework Convention on Climate Change (UNFCCC) in Paris 2015 (COP21), adopted its agreement on 12 December 2015 in Paris, and signed its treaty on 22 April 2016 in New York. Hence, Iran has supported the international efforts to mitigate greenhouse gas (GHG) emissions and to adapt to the impacts of climate change, based on the principle of Common but Differentiated Responsibilities (CBDR). The national strategies on climate change in Iran should be focused on mitigation the GHG emissions in the energy sector. For this purpose, the energy organization of Iran has been developed applications for renewable energy such as solar panels. In this regard, further research and development should be considered the novel methods to explore renewable energy applications and to mitigate GHG emissions in order to overcome the increasing risk of climate change effects. Technological affairs and international participants should support this target.
Abbreviations
CDIAC:
Carbon Dioxide Information Analysis CenterCDM:
Clean Development MechanismCBDR:
Common but Differentiated ResponsibilitiesDNA:
Designated National AuthorityAR5:
Fifth Assessment ReportGHG:
Greenhouse gasIPCC:
Intergovernmental Panel on Climate ChangeRCP:
representative concentration pathwaysNASA:
National Aeronautics and Space AdministrationNCCOI:
National Climate Change Office of IranNPA:
National Plan of ActionSYR:
synthesis reportCOP21:
21st Conference of the PartiesUNFCCC:
United Nations Framework Convention on Climate Change
References
- Abolverdi J, Ferdosifar G, Khalili D, Haghighi AK, Haghighi MA (2014) Recent trends in regional air temperature and precipitation and links to global climate change in the Maharlo watershed, Southwestern Iran. Meteorol Atmos Phys 126:177–192. https://doi.org/10.1007/s00703-014-0341-5Article Google Scholar
- APDRC (2019). Asia pacific data research center web-based data server. national oceanic and atmospheric administration (NOAA). http://apdrc.soest.hawaii.edu/las/getUI.do
- Bazrkar MH, Zamani N, Eslamian S, Eslamian A, Dehghan D. (2015) Urbanization and climate change. In: Filho WL (ed.), Handbook of climate change adaptation. Springer, Berlin, pp. 619-655. Doi: 10.1007/978-3-642-40455-9_90-3
- CDIAC (2014). Carbon dioxide information analysis center. united states department of energy. http://cdiac.ornl.gov
- Choobari OA, Najafi MS (2018) Extreme weather events in Iran under a changing climate. Clim Dyn 50:249–260. https://doi.org/10.1007/s00382-017-3602-4Article Google Scholar
- Choobari OA, Adibi P, Irannejad P (2017) Impact of the El Niño-Southern Oscillation on the climate of Iran using ERA-Interim data. Clim Dyn 51:2897–2911. https://doi.org/10.1007/s00382-017-4055-5Article Google Scholar
- Darand M, Daneshvar MR (2014) Regionalization of precipitation regimes in iran using principal component analysis and hierarchical clustering analysis. Environ Process 1:517–532. https://doi.org/10.1007/s40710-014-0039-1Article Google Scholar
- Darand M, Masoodian A, Nazaripour H, Mansouri Daneshvar MR (2015) Spatial and temporal trend analysis of temperature extremes based on Iranian climatic database. Arab J Geosci 8(10):8469–8480. https://doi.org/10.1007/s12517-015-1840-5Article Google Scholar
- Dinpashoh Y, Fakheri-Fard A, Moghaddam M, Jahanbakhsh S, Mirnia M (2004) Selection of variables for the purpose of regionalization of Iran’s precipitation climate using multivariate methods. J Hydrol 297(1–4):109–123. https://doi.org/10.1016/j.jhydrol.2004.04.009Article Google Scholar
- Dinpashoh Y, Mirabbasi R, Jhajharia D, Abianeh HZ, Mostafaeipour A (2013) Effect of short-term and long-term persistence on identification of temporal trends. J Hydrol Eng 19(3):617–625Article Google Scholar
- Dulal HB, Brodnig G, Onoriose CG (2011) Climate change mitigation in the transport sector through urban planning: a review. Habitat Int 35:494–500. https://doi.org/10.1016/j.habitatint.2011.02.001Article Google Scholar
- Elasha BO (2010) Mapping of climate change threats and human development impacts in the Arab region. United Nations Development Programme, Arab Human Development Report (AHDR), Research Paper Series, 51 pp. http://www.arabstates.undp.org/content/rbas/en/home/library
- Eslamian SS, Gilroy KL, McCuen RH (2011) Climate change detection and modeling in hydrology. In: Blanco J, Kheradmand H (eds). Climate change e research and technology for adaptation and mitigation. InTech, p. 87–100. https://doi.org/10.5772/24550
- Fallah B, Sodoudi S, Russo E, Kirchner I, Cubasch U (2017) Towards modeling the regional rainfall changes over Iran due to the climate forcing of the past 6000 years. Quatern Int 429:119–128. https://doi.org/10.1016/j.quaint.2015.09.061Article Google Scholar
- Fanni Z, Hosayni Z, Afsharmanesh H, Nazemmahalleh MA, Rastegar A (2013) The effects of urban environment on climate changes, case study: Tehran, Iran. J Tethys. 1(2): 138-147. http://journals.pnu.ac.ir/article_2762
- Ghalhari GF, Roudbari AD, Asadi M (2016) Identifying the spatial and temporal distribution characteristics of precipitation in Iran. Arab J Geosci 9:595. https://doi.org/10.1007/s12517-016-2606-4Article Google Scholar
- Ghanghermeh AA, Roshan GR, Shahkooeei E (2015) Evaluation of the effect of Siberia’s high pressure extension on daily minimum temperature changes in Iran. Model Earth Syst Environ 1:20. https://doi.org/10.1007/s40808-015-0020-7Article Google Scholar
- Ghasemi AR, Khalili D (2008) The association between regional and global atmospheric patterns and winter precipitation in Iran. Atmos Res 88:116–133. https://doi.org/10.1016/j.atmosres.2007.10.009Article Google Scholar
- GIOVANNI (2019). Geospatial Interactive Online Visualization and Analysis Infrastructure data server. National Aeronautics and Space Administration (NASA). http://www.giovanni.sci.gsfc.nasa.gov/giovanni
- Gohari A, Eslamian S, Abedi-Koupaei J, Massah-Bavani A, Wang D, Madani K (2013) Climate change impacts on crop production in Iran’s Zayandeh-Rud River Basin. Sci Total Environ 442:405–419. https://doi.org/10.1016/j.scitotenv.2012.10.029CAS Article Google Scholar
- Hijmans RJ, Cameron SE, Parra JL, Jones PG, Jarvis A (2005) Very high resolution interpolated climate surfaces for global land areas. Int J Climatol 25(15):1965–1978. https://doi.org/10.1002/joc.1276Article Google Scholar
- IPCC (2007) Climate Change 2007—The physical science basis. Intergovernmental panel on climate change, Cambridge University Press. https://www.ipcc.ch/report/ar4/wg1
- IPCC (2012) Changes in climate extremes and their impacts on the natural physical environment. Intergovernmental Panel on Climate Change, Cambridge University Press. http://www.fapesp.br/eventos/2012/08/IPCC/JMarengo.pdf
- IPCC (2014) Climate change 2014: synthesis report (SYR). Intergovernmental panel on climate change, Geneva; p. 151. https://www.ipcc.ch/report/ar5/syr
- Karandish F, Mousavi S (2018) Climate change uncertainty and risk assessment in Iran during twenty-first century: evapotranspiration and green water deficit analysis. Theoret Appl Climatol 131:777–791. https://doi.org/10.1007/s00704-016-2008-2Article Google Scholar
- Karandish F, Mousavi S, Tabari H (2017) Climate change impact on precipitation and cardinal temperatures in different climatic zones in Iran: analyzing the probable effects on cereal water-use efficiency. Stoch Env Res Risk Assess 31:2121–2146. https://doi.org/10.1007/s00477-016-1355-yArticle Google Scholar
- Lucas C, Timbal B, Nguyen H (2014) The expanding tropics: a critical assessment of the observational and modeling studies. WIREs Clim Change 5:89–112. https://doi.org/10.1002/wcc.251Article Google Scholar
- Madani K (2014) Water management in Iran: what is causing the looming crisis? J Environ Stud Sci 4(4):315–328. https://doi.org/10.1007/s13412-014-0182-zArticle Google Scholar
- Mansouri Daneshvar MR, Hussein Abadi N (2017) Spatial and temporal variation of nitrogen dioxide measurement in the Middle East within 2005–2014. Model Earth Syst Environ 3:20. https://doi.org/10.1007/s40808-017-0293-0Article Google Scholar
- Modarres R, Sarhadi A (2009) Rainfall trends analysis of Iran in the last half of the twentieth century. J Geophys Res 114:D3. https://doi.org/10.1029/2008JD010707Article Google Scholar
- Modarres R, Sarhadi A, Burn DH (2016) Changes of extreme drought and flood events in Iran. Global Planet Change 144:67–81. https://doi.org/10.1016/j.gloplacha.2016.07.008Article Google Scholar
- NASA (2019) Global land-ocean temperature index. National aeronautics and space administration. http://data.giss.nasa.gov/gistemp
- Nazaripour H, Mansouri Daneshvar MR (2014) Spatial contribution of one-day precipitations variability to rainy days and rainfall amounts in Iran. Int J Environ Sci Technol 11(6):1751–1758. https://doi.org/10.1007/s13762-014-0616-xArticle Google Scholar
- Nazemosadat MJ, Ghasemi AR (2004) Quantifying the ENSO related shifts in the intensity and probability of drought and wet periods in Iran. J Clim 17(20):4005–4018. https://doi.org/10.1175/1520-0442(2004)017%3c4005:QTESIT%3e2.0.CO;2Article Google Scholar
- NCCOI (2010) Second national communication to UNFCCC. National Climate Change Office of Iran. http://climate-change.ir. https://unfccc.int/resource/docs/natc/iranc2.pdf
- NCCOI (2014) Third national communication to UNFCCC. National Climate Change Office of Iran. http://climate-change.ir. https://unfccc.int/sites/default/files/resource/ThirdNationalcommunicationIRAN.pdf
- Ouzounov D, Liu D, Chunli K, Cervone G, Kafatos M, Taylor P (2007) Outgoing long wave radiation variability from IR satellite data prior to major earthquakes. Tectonophysics 431(1–4):211–220. https://doi.org/10.1016/j.tecto.2006.05.042Article Google Scholar
- Previdi M, Liepert BG (2007) Annular modes and Hadley cell expansionunder global warming. Geophys Res Lett 34(L22):701. https://doi.org/10.1029/2007GL031243Article Google Scholar
- Rahimzadeh F, Asgari A, Fattahi E (2009) Variability of extreme temperature and precipitation in Iran during recent decades. Int J Climatol 29(3):329–343. https://doi.org/10.1002/joc.1739Article Google Scholar
- Raziei T, Mofidi A, Santos JA, Bordi B (2012) Spatial patterns and regimes of daily precipitation in Iran in relation to large–scale atmospheric circulation. Int J Climatol 32(8):1226–1237. https://doi.org/10.1002/joc.2347Article Google Scholar
- Raziei T, Daryabari J, Bordi I, Pereira LS (2014) Spatial patterns and temporal trends of precipitation in Iran. Theoret Appl Climatol 115(3–4):531–540. https://doi.org/10.1007/s00704-013-0919-8Article Google Scholar
- Razmi R, Balyani S, Daneshvar MR (2017) Geo-statistical modeling of mean annual rainfall over the Iran using ECMWF database. Spatial Inform Res 25:219–227. https://doi.org/10.1007/s41324-017-0097-3Article Google Scholar
- Roushangar K, Alizadeh F, Adamowski J (2018) Exploring the effects of climatic variables on monthly precipitation variation using a continuous wavelet-based multiscale entropy approach. Environ Res 165:176–192. https://doi.org/10.1016/j.envres.2018.04.017CAS Article Google Scholar
- Sabziparvar AA, Mirmasoudi SH, Tabari H, Nazemosadat MJ, Maryanaji Z (2010) ENSO teleconnection impacts on reference evapotranspiration variability in some warm climates of Iran. Int J Climatol 31(11):1710–1723. https://doi.org/10.1002/joc.2187Article Google Scholar
- Samadi SZ, Mahdavi M, Sharifi F (2009) Methodology for selecting the best predictor for climate change impact assessment in Karkheh Basin. Iran. J Environ Eng Sci. 51:249–256CAS Google Scholar
- Sarvari H (2019) A survey of relationship between urbanization and climate changefor major cities in Iran. Arab J Geosci 12:131. https://doi.org/10.1007/s12517-019-4313-4Article Google Scholar
- SCI (2016). Official report of Iran population. Statistical Center of Iran. http://www.amar.org.ir
- Shamami FG, Sabziparvar AA, Shinoda S (2018) Long-term comparison of the climate extremes variability in different climate types located in coastal and inland regions of Iran. Theor Appl Climatol. https://doi.org/10.1007/s00704-018-2523-4Article Google Scholar
- Sodoudi S, Noorian A, Geb M, Reimer E (2010) Daily precipitation forecast of ECMWF verified over Iran. Theoret Appl Climatol 99:39–51. https://doi.org/10.1007/s00704-009-0118-9Article Google Scholar
- Soltani S, Saboohi R, Yaghmaei L (2012) Rainfall and rainy days trend in Iran. Climat Change 110(1–2):187–213. https://doi.org/10.1007/s10584-011-0146-1Article Google Scholar
- Somee BS, Ezani A, Tabari H (2012) Spatiotemporal trends and change point of precipitation in Iran. Atmos Res 113:1–12. https://doi.org/10.1016/j.atmosres.2012.04.016Article Google Scholar
- Stephens GL, Ellis TD (2008) Controls of global-mean precipitation increases in global warming GCM experiments. J Clim 21(23):6141–6155. https://doi.org/10.1175/2008JCLI2144.1Article Google Scholar
- Tabari H, Talaee PH (2011) Temporal variability of precipitation over Iran: 1966–2005. J Hydrol 396(3–4):313–320. https://doi.org/10.1016/j.jhydrol.2010.11.034Article Google Scholar
- Tabari H, AghaKouchak A, Willems P (2014) A perturbation approach for assessing trends in precipitation extremes across Iran. J Hydrol 519:1420–1427. https://doi.org/10.1016/j.jhydrol.2014.09.019Article Google Scholar
- Trenberth KE (2011) Changes in precipitation with climate change. Climate Res 47:123–138. https://doi.org/10.3354/cr00953Article Google Scholar
- Zarenistanak M, Dhorde AG, Kripalani RH, Dhorde AA (2015) Trends and projections of temperature, precipitation, and snow cover during snow cover-observed period over southwestern Iran. Theoret Appl Climatol 122:421–440. https://doi.org/10.1007/s00704-014-1287-8Article Google Scholar
- Zhang X, Aguilar E, Sensoy S, Melkonyan H, Tagiyeva U, Ahmed N, Kutaladze N, Rahimzadeh F, Taghipour A, Hantosh TH, Albert P (2005) Trends in middle east climate extremes indices during 1930–2003. J Geophys Res 110:1–12. https://doi.org/10.1029/2005JD006181Article Google Scholar
- Zohrabi N, Bavani AM, Goodarzi E, Eslamian S (2014) Attribution of temperature and precipitation changes to greenhouse gases in northwest Iran. Quatern Int 345:130–137. https://doi.org/10.1016/j.quaint.2014.01.026Article Google Scholar
Authors’ contributions
All authors were equally involved in analyzing and editing the paper. All authors read and approved the final manuscript.
Acknowledgements
We thank anonymous reviewers for technical suggestions on data interpretations.
Competing interests
The authors declare that they have no competing interests.
Availability of data and materials
The data that support the findings of this study are available from the corresponding author upon request.
Ethics approval and consent to participate
This article does not contain any studies with participants performed by any of the authors.
Funding
This study was not funded by any grant.
Informed consent
Informed consent was obtained from individual participant included in the study.
Publisher’s Note
Springer Nature remains neutral with regard to jurisdictional claims in published maps and institutional affiliations.
Author information
Affiliations
- Department of Geography and Natural Hazards, Research Institute of Shakhes Pajouh, Isfahan, IranMohammad Reza Mansouri Daneshvar
- Department of Physical Geography, Hakim Sabzevari University, Sabzevar, IranMajid Ebrahimi
- Department of Physical Geography, Ferdowsi University of Mashhad, Mashhad, IranHamid Nejadsoleymani
Corresponding author
Correspondence to Mohammad Reza Mansouri Daneshvar.
Rights and permissions
Open Access This article is distributed under the terms of the Creative Commons Attribution 4.0 International License (http://creativecommons.org/licenses/by/4.0/), which permits unrestricted use, distribution, and reproduction in any medium, provided you give appropriate credit to the original author(s) and the source, provide a link to the Creative Commons license, and indicate if changes were made.